
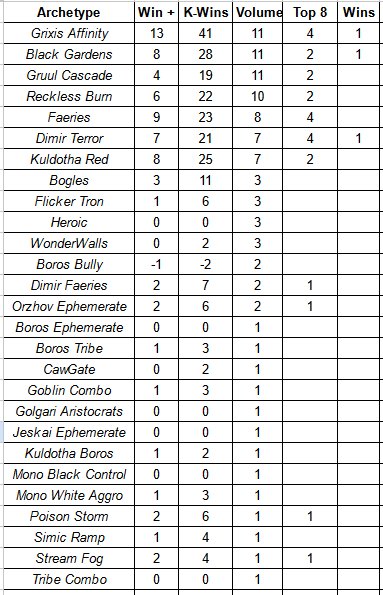
I use a few different metrics when looking at the Top 32 metagame. The first is just Raw Volume. The second is Win+, which takes the sum of all wins at X-2 or better in the Swiss and assigns a score; Win+ is helpful in measuring a deck’s Swiss round performance. K-Wins takes all of a deck’s wins and subtracts its losses, Top 8 inclusive; this helps to give a measure of overall performance. The final is one I call Meta Score, which takes the average of Win+ and K-Win to try and position an archetype against its field. This number helps to provide the most robust image of a deck’s performance.
Magic Online is just over a week away from Tales of Middle-Earth hitting the digital shelves. March of the Machine season has one more weekend left in the hopper. Today, instead of recapping the previous weekend, I want to dive into a way I’ll be discussing the Pauper metagame moving forward.
If you follow me on various platforms you probably know I am a huge New York Mets fan. I love baseball and even though my team of choice might not be doing so great at the time of this writing, I can still turn to the sport for inspiration. Baseball is a game of numbers, and the amount of stats available help to compare different players against each other not only in the current season but across several eras. One of these metrics is Wins Above Replacement, or WAR. WAR takes a player’s overall contributions and compares it to an average Major League Baseball Player; the higher the WAR the better the player. WAR can also be used to measure historical greatness – Babe Ruth holds a lifetime WAR of 182.6 (according to Baseball Reference) while Shohei Ohtani has a current lifetime MLB WAR of 28.2.
I have been searching for wars to bring WAR to Pauper. Pauper is a format where there is a lot of data from the Magic Online events but it can be hard to fully make heads or tails of it. Over the years I’ve worked on tracking Swiss performance (Win+) and total performance (KWins) and just last week I started tracking an overall Meta Score. This last step was exactly what we needed to take a step towards WAR. If a strategy had a Meta Score in a given weekend then there had to be an average Meta Score. This average Meta Score could then be taken for a field and a deck’s individual Meta Score could be measured against it. The result would be a measure of a strategy’s performance against a closed field of an “average” finish.
Here’s how it works. Every archetype gets an average Win+ Score, which measures an average Swiss performance , and an average K Win score, which measures average overall performance. These two values are then averaged to provide a Meta Score. The total Meta Score for a given subset (a weekend, a season ,etc) is then divided by the number of total archetypes present in that field to provide the Average Meta Score. This becomes the baseline and is then subtracted from each archetype’s metascore to get a Meta Score Above Replacement.
Now there are some issues with this measure. first, I only gather data of the Top 32 publicly available decklists. The result is that this statistic, while useful, is not as robust as it could be if complete tournament data as easily on hand. Similarly, this does not take into account every Pauper event played, but simply the Magic Online Challenges. These formulas could be applied to tabletop events for a more comprehensive look at the metagame.
The other major issue is that as of this writing I have only run the calculations for March of the Machine season to this point. To that end I am going to ask that if this kind of analysis interests you and you want to see some comparisons between the different eras of Pauper to please consider signing up for my Patreon or contributing to my Ko-Fi. If there is enough interest I will carve out the time, but I want to make sure there’s an audience.
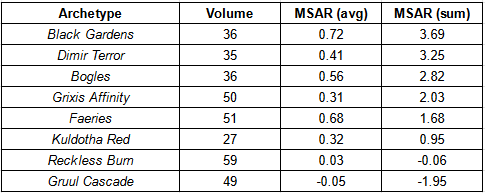
So with that out of the way, let’s look at the 16 Challenges and 2 Showcases in March of the Machine season (thus far). For this I will be examining the Top 8 decks by volume in the meta thus far – only one of these strategies falls beneath the 5% volume threshold (and it clocks in at 4.77%). For this exercise I am looking at average Meta Score Above Replacement (MAR) as well as Cumulative for the season.
Now this clearly does not tell the whole story but it does help provide context to what takes place in Pauper events. MSAR is a tool like so many others and it helps contribute to a deeper understanding of the Pauper metagame.
So what is it telling us today? Black Gardens has had an absurd season, as has Dimir Terror. Boggles numbers may be buoyed by a few particularly strong weekends and red, overall, is above average but potentially behind other major players. Gruul Cascade has some incredibly good weekends and some where it can barely put one foot in front of the other, indicating that build is more at the whim of variance.
Does this sort of analysis interest you? What would you like to see as we dive deeper into the realm of Pauper stats?
I want to take a moment to thank all my Patrons – both old and new. I am going to do my level best to keep providing you with the kind of content that brought you here in the first place. If you are interested in supporting my work, rewards for my Patreon start at just $1 and every little bit helps.
Can’t make a commitment to Patreon? I now have a Ko-Fi where you can make a one time contribution.
Looking for another way to support my work? Click here for my TCGPlayer affiliate link. Any purchases through the link let the folks there know you like my content!
